Strategy

How Ignoring Variation Can Lead To Terrible Investment Decisions

"It is remarkable how much long-term advantage people like us have gotten by trying to be consistently not stupid, instead of trying to be very intelligent." -Charlie Munger

On a recent trip abroad I took some time to think about the decision of 51.9% of UK voters to leave the European Union. As I sifted through the commentary regarding the historic vote, what struck me was how wrong the "experts" got it. The consensus of public opinion experts - at least if one uses prediction markets as a proxy - was that voters would in the end decide to stay in the EU. At certain points on Thursday before the results of the vote were released, the probability of a "remain" vote implied by betting odds stood at 90 percent. Furthermore, the majority of hedge fund managers worldwide looked at the stats and also concluded that the law of averages supported their decision to position for a "remain" vote to pass. Even the billionaire hedge fund manager Leon Cooperman told an audience of Wall Street insiders on Wednesday that there was a 70 percent probability that Britain would stay inside the European Union. "I don't worry about Brexit," he added. I myself as Head of Strategy at my investment firm Logos LP also made this mistake.

How could we all have been wrong? How could we "experts" have been caught flat footed in the face of an outcome the statistical averages so clearly suggested? The chapter on mathematics from one of my favorite books on investing by Robert Hagstrom suggests an answer: the concept of variances. Most people look at averages as basic reality, giving little consideration to the possible variances. Most of us have a tendency to see the world along the bell shape curve with two equal sides, where mean, median and mode are all the same value. The reality is that things are not so neat. Things do not always fit in a symmetrical distribution and instead skew asymmetrically to one side or another. What causes a distribution to skew to left or right is variation. As variation on one side or the other side of the median increases, the sides of the bell curve are stretched either right or left.

What does this mean in the context of Brexit? Without diving too deeply into the specific reasons 51.9% of UK voters choose to leave, many voters demonstrated high variance. Research has shown that in our "modern" digital age people make up their minds too late. According to a recent report by the market research firm Opinium, 20 percent to 30 percent of voters make a final decision within a week of casting their ballots, half of them on the day of the vote. This suggests that although a majority of UK voters polled to stay within the UK many politicians and experts ignored or simply downplayed the widespread attitude of disillusionment and misunderstanding amongst the electorate. This high variance pulled the curve to form a right skew.

In a right skewed distribution, the measures of central tendency do not coincide; the median lies to the right of the mode and the mean lies to the right of the median. If the experts had been more attuned to the concept of variance they would have been able to think deeply about the characteristics of those voters who populated the right skew of the distribution. Those individual voters who were so disillusioned with the status quo (remain in the EU) that they were unable to make up their minds until the last minute. Perhaps this knowledge would have changed their predictions.

Either way the above explanation leads me to believe that our culture favors a powerful bias to neglect or ignore variation. As the result of the Brexit vote demonstrates, focusing exclusively on measures of a central tendency can lead us to make significant mistakes.

Is there a lesson for investors? The answer is yes. As suggested by Hagstrom, perhaps the most important lesson for the prudent long-term investor is to grasp the differences between the trend of the system and the trends in the system.

There is an important distinction to be made between the average return of the stock market and the performance variation of individual stocks. To illustrate the significance of this lesson one has only to consider periods in which the S&P 500 (NYSEARCA:SPY) has been stuck in a sideways pattern. Consider the following charts:

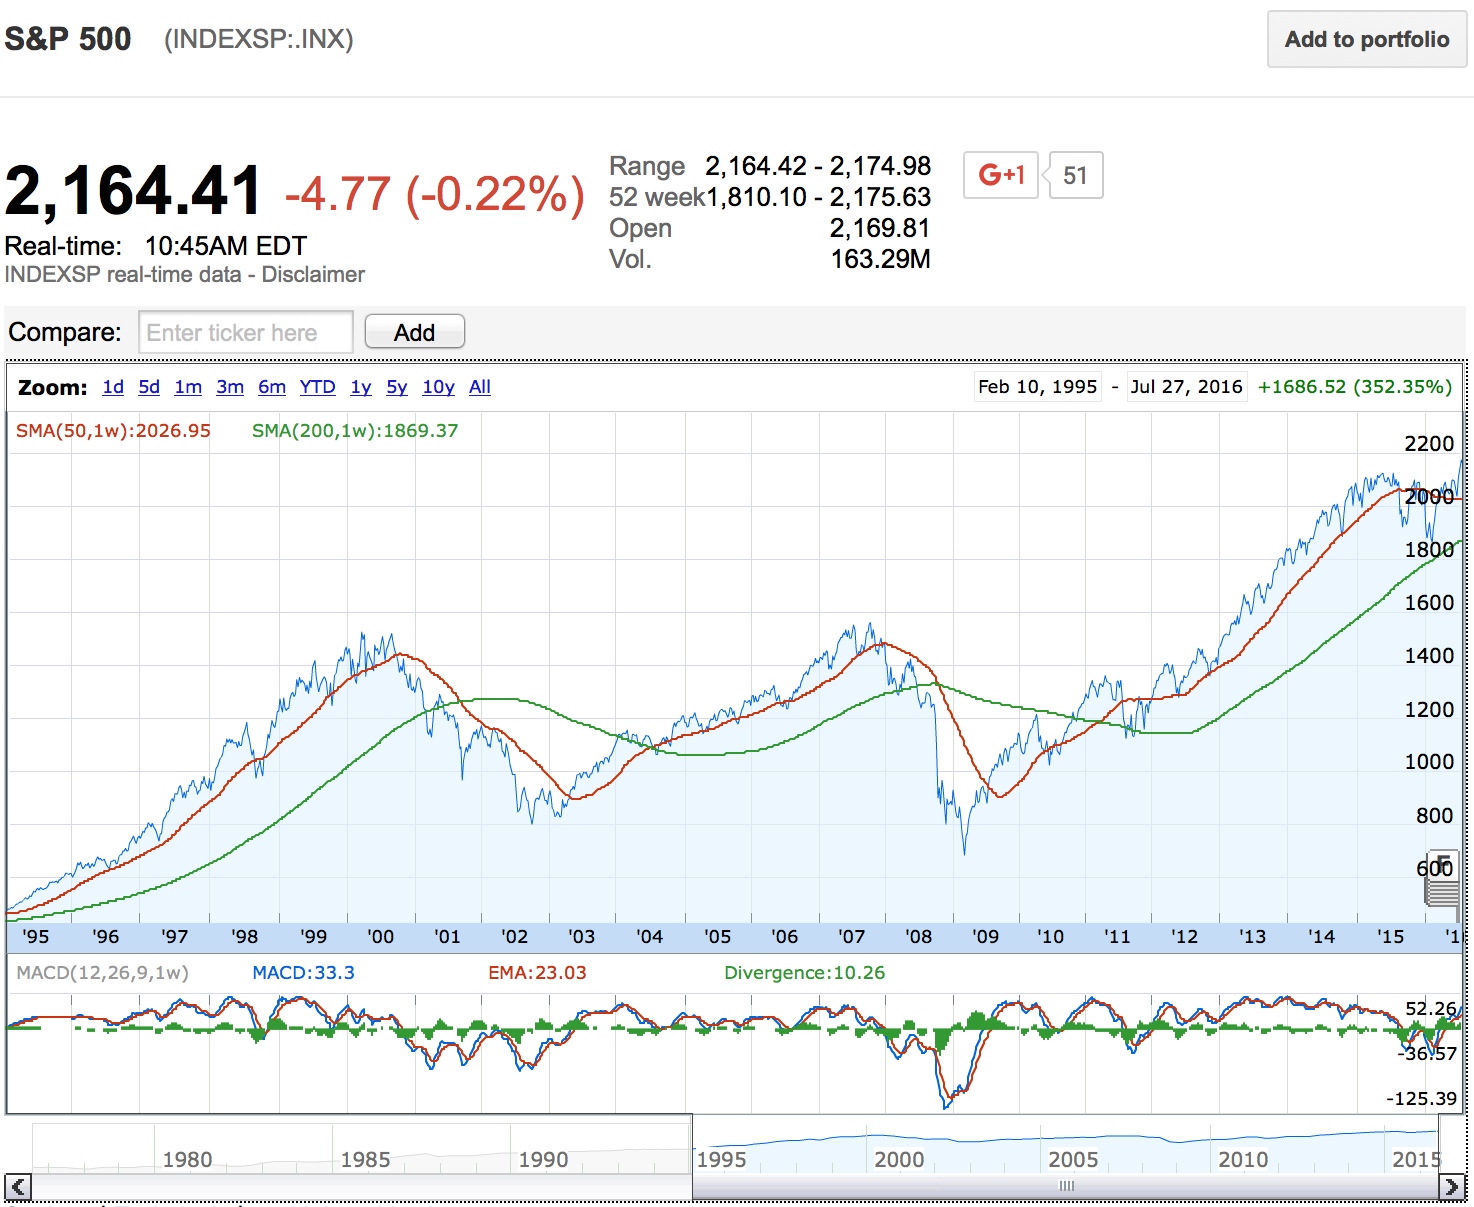
The above chart shows the S&P 500 from 1995 to present. Albeit a recent breakout which began July 1, 2016, note that from roughly December 5, 2014 the S&P 500 has gone sideways. Consider the following chart which provides a more recent snapshot:

For the vast majority of an investor's lifetime he or she will be exposed to either bull or bear markets which either go up or down. Yet at present, the investor appears to face a sideways market in which the major indexes remain range bound without a significant and sustained move higher or lower. Should investors thus conclude that stocks are a poor long-term investment?

Can history offer any insights? Consider one of the most pronounced sideways markets in history which occurred between 1975 and 1982. On October 1, 1975, the Dow Jones Industrial Average (NYSEARCA:DIA) stood at 784. Roughly 7 years later, on August 6, 1982, the Dow closed at the exact same 784. Fast forward to the present and with the market currently appearing to be stuck in a similar holding pattern, many forecasters and "experts" are concerned. They fear that in light of corporate earnings declines, weak global growth, unprecedented global monetary policy and investor complacency p/e multiples will fall leading to at worst a major correction or at best a prolonged period of low returns i.e. a sideways market.

It is no wonder that investor bearishness is at a record high. Based on research conducted by Bank of America investors ended June with the highest cash allocation on record at 5.7% on average and the lowest equity allocations in 4 years. Moreover, it looks as if investors are capitulating into bonds with an annualized year-to-date return from global government bonds at 25% in 2016, the highest return in 30 years. These three bearish indicators combined with the fact that inflows into precious metal funds hit a record during the first week of July, all point to the fact that investors are very bearish on global equities. Furthermore, Bank of America, Merrill Lynch's Bull & Bear Indicator, fell to an "extreme bear" reading of 1.6 on June 28. Is the "herd" right about the system? Should investors stay away from stocks?

In Hagstrom's book he points out that during the sideways market explained above which lasted from 1975 through 1982 Warren Buffett and Billy Ruane were both able to generate impressive returns. During this period in which the DOW gained exactly 0 percent, Buffett was able to generate a cumulative return of 676 percent and Ruane was able to generate 415 percent…

It would appear that the herd might be correct in their read about the trend of the system but dead wrong about the trends within the system. Diving deeper, Hagstrom found that over the 8-year period, only 3 percent of the 500 largest stocks on the market at that time went up in price by at least 100 percent in any one year. Yet over rolling 3 year periods, 18.6 percent of the stocks, on average, doubled. That equals 93 out of 500. But when the holding period was extended to 5 years, an average of 38 percent of the stocks went up 100 percent or more; that's 190 out of 500.

What a mistake it would have been to focus on the market average and avoid stocks altogether during this period. To have done so was to ignore the variation within the market and thus to miss out on the myriad of opportunities to generate excess returns by investing in high quality businesses.

Whether using averages to forecast the probable result of votes such as Brexit or perhaps the US presidential election or the future returns of the stock market we would do well to pay attention to the role variance plays as we distinguish between the trend of the system and the trends in the system. We may find that there is much more at stake than simply our ability to generate excess returns over the long term…

For original article published on SeekingAlpha click here

Are markets getting frothy? Should we be more cautious? Where do we stand?

Although the May jobs report sent the Market into a bit of a tailspin, overall stock market performance has been improving since the correction in January. As all prudent investors know, good performance should never be a reason to get complacent. How should we interpret this improvement in performance?

In his seminal book "The Most Important Thing" Howard Marks reminds us that we must develop a sense for where we stand. Instead of trying to predict where the market will be in the future we must develop an ability to “take the temperature” of the market. More specifically, market cycles present the investor with a daunting challenge given that:
 
-Their ups and downs are inevitable
-They will profoundly influence our performance as investors
-They’re unpredictable as to extent and, especially timing

In the face of these challenges the investor has a few options:

1) Believe that market cycles are predictable and put more effort behind trying to predict the future

2) Accept that the future isn't knowable and simply try and ignore cycles by buying and holding high quality businesses

3) Figure out where we are in terms of each cycle and make intelligent investment decisions accordingly

Knowing where we are in the cycle doesn't imply predicting the future but what it does mean is that we can gain better insight into the probability of events occurring in the future. The challenge is developing an alertness to the behavior of market participants as well as an ability to make inferences. What are the deeper implications of what we observe around us? If a majority of people are exhibiting extreme pessimism, can we be more aggressive?

This isn't about forecasting, it is about deep reflection on present observations.

Yet what factors should we be alert to? What observations matter more than others? What signals should we watch in order to make intelligent inferences? To answer these questions, consider Marks’ poor man’s guide to market assessment included below. Listed are a number of market characteristics. For each pair, think deeply about the one you think is most descriptive of today. If you find that most of your findings are in the left hand column, then hold on to your wallet. If most are in the right then consider a more aggressive capital allocation strategy. We believe that at present the balance seems to be tilted to the the right…..

5 Ways To Handle A Low Return On Capital Environment

CNBC pundits, analysts, hedge fund gurus and amateur market watchers love to make predictions about the future. They hum and haw about macro forces. They discuss the possible impacts of a rate increase and they debate the importance of China as the world's growth engine. They try and pinpoint what the next "game-changing" technologies or companies will be and they try and estimate what the overall market will do. This preoccupation with the future is certainly fascinating to seasoned market participants but what does it all mean for the majority of investors who most likely have a large portion of their savings exposed to the stock market or at the very least is considering where to allocate their savings? At the very least market fundamentals and economy wide transformations suggest that investors should prepare for more muted returns from their equity portfolios.

To continue reading please visit Seeking Alpha.

Non-Cyclical Consumer Healthcare': How This Sector Will Create Long-Term Wealth

Allow me to provide you with a hypothetical portfolio containing only 5 stocks. This portfolio is somewhat diversified in that each company operates in different markets with different threats, competitors and opportunities, but all 5 companies have one thing in common – they all operate in what I like to call the “non-cyclical consumer healthcare” sector.

Let’s look at the specifics of the portfolio: Company A operates in bio-hazardous waste removal at your local doctor’s office or blood clinic, Company B provides sleep apnea equipment and humidifiers for the home, Company C is in drug retailing and distribution, Company D manufactures heart valves for critically ill patients, and Company E manufactures ophthalmic medications and OTC products (i.e. eye drops) for consumers. The main characteristic of the ‘sector’ is this: it involves companies that create healthcare products that are integral to the lives of consumers or make the delivery of family medicine more effective but without the incredibly large cap-ex or intense R&D expenses involved with your typical pharma giant or biotechnology firm (i.e. typically 20% of sales goes to R&D for large pharma or biotech compared to less than 10% for companies in this ‘sector’).

Rethink Pfizer (NYSE:PFE), Sanofi (NYSE:SNY), Gilead Sciences (NASDAQ:GILD), AstraZeneca (NYSE:AZN), Eli Lilly (NYSE:LLY), Merck (NYSE:MRK), Novartis (NYSE:NVS), GlaxoSmithKline (NYSE:GSK) or Johnson and Johnson (NYSE:JNJ). These businesses are elephants in the pharma jungle and have massive purses focused on their R&D. Huge cap-ex, huge investments, potential for write-downs and losses. Their business model is chasing their never ending patent expirations and occasionally anchoring certain brands to broaden their portfolio (i.e. Neutrogena for JNJ or Sensodyne for GSK). Moreover, rethink biotechnology. The volatility in some of these names can be difficult to stomach and the cash flows generated by these businesses is much less predictive than the pharma giants.

There is no question certain biotech names have done very well over the last 5 years, some giving investors over 10x return in that timespan, but this sector requires specialized knowledge and productive research pipelines so that companies may create joint ventures with the big pharma giants to achieve mass production. To be clear, none of the aforementioned sectors or businesses are bad investments. An investor with thorough research who is confident in these businesses and has a long-term outlook can do very well, sometimes beating the market by very large percentages. However, this third sector, the “non-cyclical consumer healthcare sector”, has much more predictive business models (lower beta), strong organic growth, large margins and goes to the heart of what is necessary to the successful mass consumption of medicine. They are businesses that have recession proof portfolios and their ‘moats’ are created by scale, acquisitions and affordable innovation leading to quality products, services and brands.

Back to our hypothetical portfolio for a moment: how has this portfolio performed and what are these mysterious companies?

Over the last 10 years, this portfolio has performed +450% versus 72.99% by the S&P 500. What’s more, this portfolio has a beta of just 0.56, indicating pretty impressive risk-adjusted returns compared to the 2+ beta commonly seen in many biotech names. The companies in this portfolio are: Stericycle (SRCL – Company A), ResMed (RMD – Company B), McKesson (MCK – Company C), Edward Lifesciences (EW – Company D), Akorn (AKRX – Company E).

It is evident that these leaner, smaller and growing enterprises within this sector have had a great run, but will this performance continue and will this sector outperform in the future?

It is predicted that on a macro-level, consumer healthcare will grow by at least 50% over the next 5 years. Highly specialized players focused on niche markets (like the names in our hypothetical portfolio) may outperform the broader market over the long-term for a number of reasons, including but not limited to: increased demand on individual well-being due to aging, growing and shifting populations; governments seeking to control administrative healthcare costs; continued innovation leading to new products and markets; continued international expansion into “pharmerging markets”; healthy margin expansion; potential consolidation within the sector.

Concomitantly, prudent management and sound corporate strategy play a central role in the success of these companies. For example, Stericycle has a very focused corporate strategy which propelled them out of their struggles in the early 1990s to the strong cash flow operator it is today. Rather than targeting large pharmaceutical giants as clients, SRCL decided to establish itself piece by piece in very small markets (i.e. providing waste disposal for family doctor’s offices and small blood banks where the contracts are smaller but the margins and switching costs are higher) which later created the cash flows necessary to expand into new markets (i.e. retail bio-hazard waste removal, manufacture recalls).

This strategy of has been hugely successful for SRCL: the company has made over 350 acquisitions domestically and internationally since 1993 and this grassroots approach to bio-hazard waste removal has made them vital for millions of medical professionals around the globe. It has cemented their brand with that of ‘quality waste removal’, ‘safety’ and ‘compliance’ which has led to very large contracts with hospitals, pharmaceutical firms and international organizations (i.e. SRCL acquired a special permit for Ebola waste removal during the West Africa outbreak in 2014).

Unlike SRCL, Waste Management (NYSE:WCN) did not have a strong presence in bio-hazard removal and only recently (2009) decided to compete with SRCL “head-on“. However, WCN knows one thing: they can only go after the large hospital and pharmaceutical contracts. Why? Because the footprint that SRCL has created for ‘micro’ waste disposal market is very deep: SRCL has too much scale and brand equity in this ‘mass medical’ market which leaves WCN with the unenviable task of competing with SRCL through a market with lower switching costs, lower margins and more internal competition.

There are many examples of solid strategic initiatives by companies in this sector (i.e. ResMed’s core growth strategy is to focus and promote sleep testing equipment for the home and enhancing communication between primary care physicians and the patient) but it is important to note that we are not suggesting a blanket ‘outperform’ rating by every single company in this sector. Business always has winners and losers, and there will certainly be some ‘losers’ in this sector if companies are not focused, lack hunger and innovation or do not adapt or prepare to the dynamics of changing global markets.

Another way to get exposed into this sector is to look at technology. Big data is changing the way healthcare companies of all levels (hospitals, pharmaceutical companies, medical supply companies and biotech companies) are able to recognize and meet the demands of patients. It is estimated that big data will contribute at least $300 billion in value to US healthcare every year.

Names like Anthem Inc. (NYSE:ANTM), Fair Isaac Corp. (NYSE:FICO), Verisk Analytics (NASDAQ:VRSK), Centene Corp. (NYSE:CNC) and traditionally large tech players like Oracle (NYSE:ORCL), Molina Healthcare (NYSE:MOH) and Accenture (NYSE:ACN) will all benefit from this growing market as productivity demands for healthcare analytics continue to rise.

Overall, as long-term investors seeking value, we will continue to monitor this sector and allocate capital to select names. At minimum, a long-term investor should carve up a portion of their portfolio to this sector if he or she wants to see above average returns over the next 25 years.

Does Socially Responsible Investing Have Hidden Costs?

The Millennial generation has become known as a more socially conscious generation, preoccupied with the environment, sustainability and quality of life. As these millennials enter the workforce and begin investing they will continue to support the growth of socially responsible investing. What are the implications of this new investment trend?

Instead of favoring profitability above all else, socially responsible investors choose companies on the basis of their performance across a broad range of social, environmental, governance indicators and rank at the top of their industry group. This is no small trend. There even exists a United Nations document outlining Principles for Responsible Investment now listing around 1,349 signatories. Furthermore, it has been estimated by the U.S. SIF's 2014 Report on U.S. Sustainable, Responsible and Impact Investing Trends that socially responsible investing (SRI) portfolios have reached around $6.57 trillion at the start of 2014, a 76% increase on the number reported in 2012. These assets now account for more than one out of every six dollars under professional management in the United States. That would be 18% of the $36.8 trillion in total assets under management.

To continue reading please visit Seeking Alpha.